
Trading Strategies
advantageFX brings you a collection of trading strategies which you can use in your own trading. These trading strategies are free to use for anyone and we offer a wide selection of different trading strategies that can be used from M1 timeframe all the way to the Daily timeframe. We hope that everyone can find a strategy that fit your trading style.
Our strategies are divided by time-frame. Simply select your preferred timeframe you like to trade on and you will be presented with few strategies to choose from.
M1
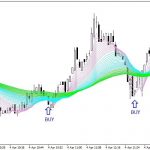
Scalping strategy with EMA
4/5
Recommended timeframes: M1
Instruments: major Forex instruments with low spreads such as EUR/USD, GBP/USD, AUD/CAD, USD/CAD. The number of instruments could vary and should be chosen depending on the spreads offered by your broker.
Timeframes: M1, M5
There are three groups of indicators that are used I the strategy:
– EMA with periods 2, 3, 4, 5, 6, 7, 8, 9, 10, 11, 12, 13, 14, 15 (pink colour)
– EMA with periods 17, 19, 21, 23, 25, 27, 29, 31, 33, 35, 37, 39, 41 (blue colour)
– EMA with periods 44, 47, 50, 53, 56, 59, 62, 65, 68, 71, 74 (green colour)
When to open long positions:
Buy when the pink EMA crosses over the green EMA from the top. Add to the long position when the price touches the green or the blue line and returns to the pink line.

When to open short positions:
Sell then the pink EMA crosses over the green EMA from the bottom. Add to the short position when the price touches the green or the blue line.

When to take profit:
On the M1 chart, take-profit is placed 5-7 points away from the entry level when opening an initial position and 4 points away from the entry level.
On the M5 chart, take-profit is placed 12-20 points away from the entry level when opening the initial position and 7 points away when adding to the position. Stop loss is placed 18 points away from the entry level.
Scalping system 10 points
4/5
Recommended timeframes: M1
Instruments: major Forex instruments with low spreads such as EUR/USD, GBP/USD, AUD/CAD, USD/CAD. The number of instruments could vary and should be chosen depending on the spreads offered by your broker.
Timeframes: M1
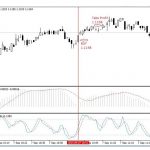
We can add MACD Oscillator where the settings (13, 26 and 9) and Stochastic Oscillator the settings (5, 3 and 3), which will be used as indicators. The best time periods for trading with the use of this strategy is the European and the American Sessions. It is preferable to choose a currency pair with the medium or high volatility (currency pairs of the Major group are quite suitable). After adjusting the chart ad adding the required indicators, follow the instructions below to open trading positions
When to open long positions:
– the lines of the MACD histogram are in the positive zone above the zero level;
– after the decline below the level 20, Stochastic Oscillator (the line %K or %D) has risen above this level.
Stop loss is set at the distance of oner point below the nearest local low.
Take profit is set at the level of 10 points fro the opening price.

A candlestick, which is marked on the chart with the period M1 meets the requirements for opening the long position. (Fig 1)
When to open short positions:
The following conditions can be used as a signal for opening short positions:**
– the lines of the MACD histogram are in the negative zone below zero level;
-after the rise above the level 80 in the overbought zone, Stochastic Oscillator (the line %K or %D) fell below this level.
Stop loss is set at the distance of one point above the nearest local high.
Take profit is set at the level of 10 points form the opening price.

A candlestick, which is marked on the chart with the period M1 meets the requirements for opening the short positions (Fig 2)
When to take profit:
Take profit is set at the level of 10 points form the opening price.
Scalping with Parabolic Sar and CCI
4/5
Recommended timeframes: M1
Instruments: major Forex instruments with low spreads such as EUR/USD, GBP/USD, AUD/USD. The number of instruments could vary and should be chosen depending on the spreads offered by your broker.
Timeframes: M1
This strategy is based on Parabolic SAR and the Commodities Channel Index indicators. That’s and impulse strategy founded on the current price trend.
Indicators:
– EMA 50 on M1 timeframe
– EMA 21 on M5 timeframe
– CCI (45)
– Parabolic SAR (0.02, 0.2)
When to open long positions:
Long positions should be opened when the point of the Parabolic SAR indicator is located above the EMA’s line and the value of the CCI indicator is more then 100

When to open short positions:
Short positions should be opened when the point of the Parabolic SAR indicator is located below the EAM’s line and the value of the CCI indicator is less then 100.

When to take profit
Target: EUR/USD (7 to 12 points), AUD/USD (5 to 8 points), GBP/USD (7 to 15) points) Stop loss level should be placed at the EMA level.
Strategy based on news
4/5
Recommended timeframes: M1
Instruments: For this strategy we can choose this major pairs, for which the news will have the strongest impact, triggering the highest movement in one if these pairs: EUR/USD, GBP/USD, USD/JPY, AUD/USD, USD/CAD and NZD/USD
Timeframes: M1
This article will describe a simple but effective strategy based on the most important macro-economic news. For this strategy we will use pending orders Buy Stop and Sell Stop, where Stop loss will be placed as there short distance from the opening price level, while the Take profit is at the long distance form the opening price, or orders can be closed manually.
The key factor of placing an order is the choice of the news, which will cause the strongest momentum in the market. The most important news are subdivided into the following information groups
– Non-farm Payrolls
– Industrial production
– PPI
– GDP
– CPI
– Unemployment
– Consumer Confidence
– Money supply
– Harmonized Index Customer Price (UK and Europe)
– Trade Balance
– Current Account
– Tankan
– ISM (USA), PMI (Eurozone), CIPS (UK)
– Michigan Sentiment Index
– Beigie Book
– Chicago PMI Index
We shall compare the time on the news calendar with the time of the trade terms.
Next steps to follow: use the timeframe M1 or M5
When to open pending orders:
2 or 3 minutes prior to the movement of issuing the news, place pending orders Buy Stop and Sell Stop as the distance of the previous high and low of the price for the last 10 – 15 minutes, however they should not be closer then 8 points from the current price level. In order to minimise losses it is recommended to Stop loss at the level of 3-4 spreads from the current price of the currency pair. It is also advisable to place Take profit either as the level of 80-90 points or do not place it at all, but just follow the price movement.
The order will be activated at the moment if issuing the news, if the price does not reach Stop loss, moving in the favourable direction, we shall move the Stop loss on the direction of the leap.


M5
3 Candlesticks – “High – Low”
4/5
Recommended timeframes: M5
Instruments: major Forex instruments with low spreads such as EUR/USD, GBP/USD, AUD/USD, USD/CAD. The number of instruments could vary and should be chosen depending on the spreads offered by your broker.
Conditions for entering the market:
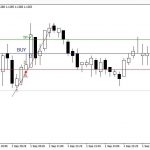
There should be three candlesticks in a row either “bullish” or “bearish” on the chart.
Stop loss:
Either High or Low level of the second candlestick
Take profit:
6 points for the pair EUR/USD, 8 points for the pair AUD/USD, 10 points for the pair GBP/USD


Cutting Points
4/5
Recommended timeframes: M5
Instruments: major Forex instruments with low spreads such as EUR/USD, GBP/USD, AUD/CAD, USD/CAD. The number of instruments could vary and should be chosen depending on the spreads offered by your broker.
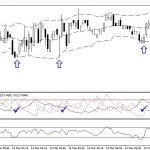
We offer for your consideration one of the speculative strategies on the Forex market. This is a scalping strategy and it is recommended to be used on the calm market when the price action is moving in a sideways channel. It is also worth noting that low spreads and fast order execution are also necessary conditions for the strategy to work.
Timeframes: M5
Indicators used:
– Bollinger Bands (20, 2)
– ADX (14 periods)
– RSI (7 periods)
When to open long positions:
– The price is below or on the lower MA of the Bollinger Bands
– The RSI is below the 30 mark
– Open long positions when the price returns above the lower Bollinger Bands

When to open short positions:
– The price is on or above the upper MA of the Bollinger Bands
– The RSI is above the 30 mark
– Open short positions when the price returns below the upper MA of the Bollinger Bands

When to take profit:
– TP on the middle MA of the Bollinger Bands
– Quick TP 3 to 5 points away from the opening level
– SL 3 points above/below the lower/upper MA of the Bollinger Bands
It is not recommended to trade 30 minutes prior to macroeconomic news releases. The condition that the RSI > 70 or <30 is not compulsory. The most important in this strategy is to determine the right moment for trading when the price remains in the sideway range.
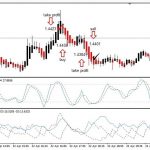
Heiken Asti + ADX + Stochastic trading strategy
3.5/5
Recommended timeframes: M5
Instruments: The strategy fits all instruments
Timeframes: M5
Indicators:
Indicators used:
– Heiken Ashi
– Stochastic (5,3,3,)
– ADX (14)
When to open long positions:
– The price of the instrument is above Heiken Ashi moving average while two bullish candles in a row have formed on the chart. At the same time, ADDX indicator is at the inside level above 22 points and shows an upward trend, and Stochastic is moving up.
When to open short positions:
– The price of the instrument is below Heiken Ashi moving average while two bearish candles in a roe have formed on the chart. At the same time, ADX indicator is below 22 points ad shows a downward trend and Stochastic is moving down.

When to take profit
– Take profit: 10-15 points. Stop loss: 5-10 points. Close long positions after a 15 point raise in price. Close short positions after a 15 point fall in the price.
Strategy with the use of Oscillators CCI and MACD
3.5/5
Recommended timeframes: M5
Instruments: For this strategy we can choose this major pairs, for which the news will have the strongest impact, triggering the highest movement in one if these pairs: EUR/USD, GBP/USD, USD/JPY, AUD/USD, USD/CAD and NZD/USD
Timeframes: M5 (M1 to H1 can also be used)
This simple strategy is based one rather strong signals of entry and exit points from the market. Two oscillators: CCI and MACD in one window are used in this strategy. The best result are achieved with the use of timeframes from M1 to H1
Indicators:
– MACD: Fast EMA – 12, slow EMA – 26, MACD SMA – 2, applied to the closing price.
– CCI Period – 14, applied to the closing price.
D0 not forget that that we use two indicators in the same window, therefore, after setting up the first indicator, the second indicator shallop be moved, with the help of the mouse, from the window “navigator” to the window of the first indicator.
When to open long positions:
– In order to open a BUY position, the red line CCI should cross the line +100 from bottom to top, while the indicator MACD shall be above the demarcation line 0. In order to close positions, the line CCI shallop go beck to level +100. However, the as practice shows it is better to close positions if the line CCI crosses the MACD.

When to open short positions:
– Open a sell position when the CCI red line crosses up the line -100 and the MACD indicator is below the demarcation line 0. Close the position when the CCI line returns to the level -100 or crosses the MACD line.

For carrying out a transaction you shallop watch over terminal tracing the readings of the indicator, since this option does not provide for a function of placing stop loss or take profit orders.
M15
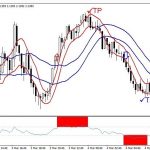
Breaking of the Double Volatility Channel strategy
3.5/5
Recommended timeframes: M15
Instruments: major Forex instruments with low spreads such as EUR/USD, GBP/USD, AUD/CAD, USD/CAD. The number of instruments could vary and should be chosen depending on the spreads offered by your broker.
Timeframes: M15 and above
Indicators:
– RSI (11) levels (35, 65)
– 20 SMA High,
– 20 SMA Low,
– 5 SMA High,
– 5 SMA Low,
When to open long positions:
If the 5 SMA, High line is above 20 SMA High and the RSI (11) is above 65, a long positions can be opened.
When to open short positions:
If the 5 SMA, High line is below 20 SMA Low and the RSI (11) is below 35, a short position can be opened.

However, if the length of the opening bar is twice the length of the previous bar positions should not be opened.
When to exit:
For long positions, take profits then the RSI (11) falls below 65. For short positions, take profits when the RSI (11) rise above 35.
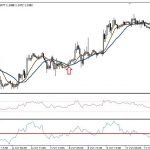
Strategy “Momentum Forex Trading”
3.2/5
Recommended timeframes: M15
Instruments: All
Timeframes: M15 and above
Trading hours: London and New York trading sessions.
Indicators:
-SMA 21 (simple moving average with the period 21),
-SMA 11 (simple moving average with the period 11),
-Momentum 30,
-RSI 14
Conditions required for opening long positions:
The indicator Momentum crosses the level 100 from bottom to top; SMA 11 is above SMA 21, while the price is above the moving average lines.
Conditions required for opening short positions:
The indicator Momentum crosses the level 100 from top to bottom; SMA 11 is below SMA 21, while the price is under the moving average lines.

Exit points:
Buy transaction shall be closed when RSI enters the overbought zone. Sell transaction shall be closed when the indicator enters the oversold zone.
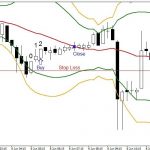
Strategy “One-Two
3.4/5
Recommended timeframes: M15
Instruments: This strategy is a variation of reversion strategies based on the “Bollinger Bands” indicator. The strategy is easy to master and uses a technical indicator pre-installed in any MT4 terminal. Therefore, standard instruments are all that a trader needs. The strategy is applicable to all currency pairs, such as EUR/USD, GBP/USD, AUD/USD, CAD/USD, NZD/ USD, and USD/JPY. All popular time-frames may be applied: M15, M30, H1, H4, and D1.
Timeframes: M15 and above
Indicators:
-Bollinger Bands (Period 20, Shift 0, Deviation 2) – the green lines on the chart
-Bollinger Bands (Period 20, Shift 0, Deviation 2) – the orange lines on the chart
Conditions for opening “Buy” trades (Pic.1):
-Wait till the price is located between the green and the orange lines. Mark this candle as “0”.
-Wait till 2 more candles are formed. If the closing prices of the candles “0” and “1” have been higher than those of previous candles (“White” candles), open a Buy trade at the opening of the candle.

Conditions for opening “Sell” trades:
-Wait till the price is located between the green and the orange lines.
-Wait till 2 more candles are formed. If the closing prices of the candles “0” and “1” have been lower than those of previous candles (“Black” candles), open a Sell trade at the opening of the candle 2.

Conditions for closing trades:
-Stop Loss at the distance of 5 points from High or Low of the candle 1.
-Targets will vary according to the instrument and time-frame. For example: 60 points for EUR/USD H4, 70 points for GBP/USD H4, 200 points for EUR/USD D1, 250 points for GBP/USD D1.
-The price reaches the middle line of Bollinger Bands -the red one on the chart.
-The trades may be also switched to the “no loss” mode once the chart has crossed the middle line of the bands.
Strategy “Range GBP/JPY”
4/5
Recommended timeframes: M15
Instruments: This strategy is applicable only to the currency pair GBP/JPY.
Timeframes: M15 and above
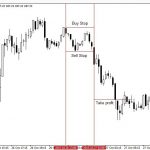
This strategy is based on trading at night time by way of placing pending orders. Therefore, this strategy does not take too much time of a trader. You will need to know closing time of the American session and opening time of the Asian session. Use the time indicated in your trading terminal. In the example below, the terminal shows server time of the Company: GTM+2. In this case closing time of the American session will be at 23:00, opening time of the Asian session is 2:00 terminal time.
In order to place an order we need to construct a rectangle in which horizontal lines will be the highs and lows of the limited time period, while 23:00 and 02:00 will be shown as the vertical lines.
As soon as the rectangle is formed, it is necessary to place a pending order Sell Stop 2 points below the lows and a pending order Buy Stop 2 points above the highs. Stop loss of each order will be at the distance of the flat, which is the opening price of the opposite pending order. Take profit should be set at the distance two times bigger than the distance to the stop-loss. Thus, we will comply with the rules of money management.
After placing the orders and getting profit, it is preferable to place at least 10-15 points of stop-loss in the breakeven zone.


After activation of one of the orders, the second order shall be also removed.
In case the range of the flat is over 70 points then, it is better not to trade on this day; it is also recommended to refrain from trading if neither of the orders has been activated within 4 hours after placing the orders.
If a transaction has not been closed with the help of stop-loss or take profit before the opening of the American session, if should be closed at the current price.
Strategy “Speculative”
3.5/5
Recommended timeframes: M15
Instruments: EUR/USD or GBP/USD
Timeframes: M15 and above
Indicators:
-Zigzag: we use standard settings, changing the Depth to 100.
-RSI: settings remain unchanged with the period 14.
Trading instruments are EUR/USD or GBP/USD.
The level of T/P: 60-100 points. The level of S/L: 15-20 points.
It is worth remembering: in case of S/L, we shall not open positions in this direction but wait for the opposite signal, that is: if after the buy transaction the price goes down up to the Stop Loss, we will not open any buy positions but will wait for the signal to sell.
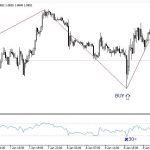
Short positions can be opened when the indicator Zigzag reaches the upper point of the candlestick or HIGH, while RSI will be in the overbought zone or above 70 (pic. 1).

Long positions can be opened when the indicator Zigzag reaches the lowest point of the candlestick or the LOW, while RSI will be in the oversold zone or below 30 (pic.2).

Strategy “The Range”
4/5
Recommended timeframes: M15
Instruments: major Forex instruments with low spreads such as EUR/USD, GBP/USD, AUD/CAD, USD/CAD. The number of instruments could vary and should be chosen depending on the spreads offered by your broker.
Recommended Timeframes: M15, M30, H1. When using the M15 time-frame, you'd better not keep your positions opened overnight or enter the market as there will be more false signals.
Indicators:
-16 and 30 period red EMAs
-12 period green WMA
-5 period black WMA
-19 period RSI with a line at 50.
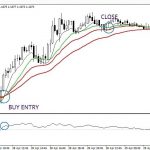
Two red moving averages form a range that signals about the start and the end of the trend line. Two weighted averages indicate market entry and exit points. A position should be opened when the range is narrow or when its borders intersect.
When to open long positions:
Open a trade once 5- and 12-period WMAs have intersected the range formed by the red moving averages from below. If the 5-period WMA crossed the red lines long before this moment, we have a powerful signal to buy.

A trade should be closed once the 5-period black WMA has crossed the red moving average.
When to open short positions:
Open a trade once both WMAs have crossed the range formed by the red EMAs from above. If the 5-period WMA crossed the red lines long before this moment, we have a powerful signal to sell. At the same time, RSI must be located below the line at 50.

When to exit:
A trade should be closed once the 5-period black WMA has crossed the red moving average.
Also, a trade should be closed if the range borders and red MAs have intersected or become too narrow: it's a signal about a trend reversal.
Strategy “The Right Moment”
4/5
Recommended timeframes: M15
Instruments: major Forex instruments with low spreads such as EUR/USD, GBP/USD, AUD/CAD, USD/CAD. The number of instruments could vary and should be chosen depending on the spreads offered by your broker.
Timeframes: M15 and H1
Indicators:
-Bollinger Bands: period 20, deviation 2.
-Williams' Percent Range: period 25.
-RSI: period 5.
This strategy is easy to use, so it can help every beginner to perceive the market, get an understanding of the overbought and oversold zones and learn to deal with them.
When using this strategy you should take into account the overall state of the market and determine its current state. As you know, the market can have upward or downward trends or it can be flat. So, this strategy is designed for the sideways movement in the market; although it is not important to see the clear boundaries, it is just sufficient if the price moves in both directions for at least a week. It will allow us to open up to two transactions per day.
In this strategy both trend indicator and oscillators/ flat indicators are used.
Let's consider an example of opening a buy position:
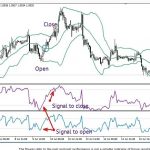
In order to open a buy position you should wait for the moment when RSI and Williams will be in the oversold zone. If RSI crosses the line 30, wait for the confirmation from Williams ó this indicator shall cross the line 80. At this moment the price shall be around the bottom band of Bollinger. At this moment you can open a position. Then, you should wait for the breakout of the middle band of Bollinger, as the price shall steadily overcome this level. If the price starts to “stall” near the resistance level, you shall lock in profit. If the price reaches the upper band of Bollinger, you should be ready to open the position, as soon as the Williams indicator does not cross the level 20 from top to bottom. Thus, you will manage to catch the entire “bullish” momentum.

Now, let's consider an example of opening a sell position:
In order to open a sell position you should wait for the moment when RSI and Williams will be in the overbought zone. If RSI crosses the line 70, wait for the confirmation from Williams ó this indicator shall cross the line 20. At this moment the price shall be around the upper band of Bollinger. At this moment you can open a position. Then wait for the breakout of the middle band of the Bollinger; the price shall overcome this level without any “hesitations”. If the average does not overcome support level, you shall lock in the minimum profit. If the price reaches the upper band of Bollinger, be prepared to close the position at the moment when Williams does not cross the level 80 from bottom to top. Thus, you will catch the entire “bearish” trend.

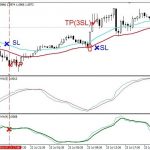
Strategy “Volatility channel breakout”
3.6/5
Recommended timeframes: M15
Instruments: All
Timeframes: M15 and above
Indicators:
-ATR (30) (Average True Range) with EMA 5 (5-period Exponential Moving Average )
-ATR (14) (Average True Range) with EMA 4 (4-period Exponential Moving Average)
-30 SMA High
-30 SMA Low
When to open long positions:
When the price has crossed both moving averages from below and ATR (30)>EMA5.
When to open short positions:
When the price has crossed both moving averages from above and ATR (30) > EMA5.
Stop loss:
When going long, place Stop Loss at the level of 30 SMA Low; when going short – at the level of 30 SMA High.
Closing of trades:
Close a trade if ATR (14)

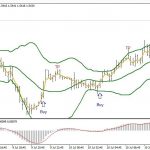
Strategy based on BB, MACD, MA indicators
3.6/5
Recommended timeframes: M15
Instruments: major Forex instruments with low spreads such as EUR/USD, GBP/USD, AUD/CAD, USD/CAD. The number of instruments could vary and should be chosen depending on the spreads offered by your broker.
Indicators:
-Bollinger bands (Period 20, Shift 0, Deviation 2)
-Smoothed moving average (Period 2, Shift 0)
-MACD indicator (Fast EMA 11, Slow EMA 27, MACD SMA 4)
Conditions for opening Buy trades:
The moving average (displayed in orange in the pictures) crosses from below the middle line of Bollinger Bands (displayed in green).
-The MACD histogram is below the line.

Conditions for opening Sell trades:
The moving average (displayed in orange in the pictures) crosses from above the middle line of Bollinger Bands (displayed in green).
-The MACD histogram is above the line.

Conditions for closing trades:
-Stop Loss at the distance of 12-16 points (depends on the type of pair)
-Take Profit near pivot points, normally at the distance of 10-15 points from the opening level.
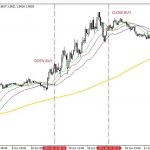
Strategy “Alligator”
4/5
Recommended timeframes: M15
Instruments: This strategy is applicable to any currency pairs and based on a simple trend following principle “buy/sell”.
Timeframes: M15
To define entry and exit points, the standard Alligator indicator and 144-period Simple Moving Average (SMA) are used. The chart time-frame is to be set at M15, but longer periods are admissible too.
The following rules should be respected when defining entry and exit points.
BUY trades shall be opened under the following conditions:
– the price is located above the SMA (144) (indication of a bullish trend)
– the green line of the Alligator indicator has crossed the red and blue lines from below.
– the red line of the Alligator indicator has crossed the blue line from below.
Stop Loss is to be placed 1 point lower than SMA 144 (all the time).
Long positions are to be closed once the green line of the Alligator indicator has crossed the red line from above (indication of the trend reversal).

Pic. 1 In the picture we can see a chart on the M15 time-frame with the indication of entry and exit points for a long position.
SELL trades shall be opened under the following conditions:
– the price is located below the SMA (144) (indication of a bearish trend)
– the green line of the Alligator indicator has crossed the red and blue lines from above.
– the red line of the Alligator indicator has crossed the blue line from above.
Stop Loss is to be placed 1 point higher than SMA 144 (all the time).
Short positions are to be closed once the green line of the Alligator indicator has crossed the red line from below (indication of the trend reversal).

Pic. 2 In the picture we can see a chart on the M15 time-frame with the indication of entry and exit points for a short position.
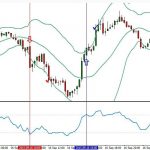
Strategy “Bollinger Bands and RSI”
3.7/5
Recommended timeframes: M15
Instruments: For this strategy we can choose this major pairs, for which the news will have the strongest impact, triggering the highest movement in one if these pairs: EUR/USD, GBP/USD, USD/JPY, AUD/USD, USD/CAD and NZD/USD
Timeframes: M15 or M30 can be used
Indicators:
-Bollinger bands (Period 20, Shift 0, Deviation 2)
-RSI (11)
Conditions for “buy” trades: the RSI value must be over 70 and the current price must be above the higher Bollinger band.
Conditions for “sell” trades: the RSI value must be below 30 and the current price must be below the lower Bollinger band.
Exit:
M15: EURUSD – 15 points, GBPUSD – 19 points.
M30: EURUSD – 19 points, GBPUSD – 25 points.
Stop Loss shall be placed 10 points higher or lower than the entry point.

M30
Coming soon
H1
Coming soon
H4
Coming soon
D1
Coming soon
Caution: Trading involves the possibility of financial loss. Only trade with money that you are prepared to lose, you must recognise that for factors outside your control you may lose all of the money in your trading account. Many forex brokers also hold you liable for losses that exceed your trading capital. So you may stand to lose more money than is in your account. advantageFX.net takes no responsibility for loss incurred as a result of our trading signals. By using the above trading strategies you acknowledge that we are not providing financial advice and that you are making the decision to copy our trades on your own account. We have no knowledge on the level of money you are trading with or the level of risk you are taking with each trade. Past performance does not indicate future results. You must make your own financial decisions, we take no responsibility for money made or lost as a result of our signals or advice on forex related products on this website.